
Source for header: “Home Security Safety Systems Cameras – Credit to informedmag.com” by Informedmag is licensed under CC BY 2.0.
Burglary crime scenes of lived-in residences make it difficult for forensic examiners to collect trace evidence. The de Poot group at the Amsterdam University of Applied Sciences developed a heatmap of touch to assist examiners in collecting evidence.
Residential burglaries have a low resolution rate; around 10% of cases are solved, while the rest grow cold. One reason is that without direct evidence, such as video recordings or witnesses, the investigation relies heavily on forensic trace evidence. In residential burglaries, there is a large amount of background trace material that comes from the residents within that home. With so much background material, it is difficult to locate fingerprint or DNA evidence of the perpetrator. Additionally, perpetrators know to minimize the evidence they leave behind by wearing gloves and wiping surfaces, making it even harder to identify relevant evidence. To aid in the collection of the little relevant trace evidence left behind at these crime scenes, the researchers in the de Poot lab at the Amsterdam University of Applied Sciences developed a map of the most likely areas for a burglar to deposit trace evidence at a crime scene. Their simulated data on where a perpetrator is most likely to deposit unique evidence could help standardize investigative decisions, since current practices rely on the CSI techs’ experience to determine where to look for evidence.
To aid in collection of evidence, the study authors derived contact heatmaps, tracking the normal use of daily objects as well as simulations of burglaries to compare the localization of burglary-related evidence. The researchers carried out experiments at the Lowlands Science 2023, a science program at the popular Lowlands Festival. Around 200 participants joined the study at the festival, with 94% reporting feeling sober when completing the activity. However, most participants reported alcohol use (77%), and some reported drug use (13%). The researchers excluded any participants who appeared visibly intoxicated. The state of the participants could significantly impact their results, especially when considering the 3-minute time constraint implemented by the researchers. Sampling such a large, general population, though, allowed the researchers to collect a large dataset for their heatmapping.
The authors set up a simulation area that asked the participants to do a series of activities (Fig. 1). The first set of activities were normal, everyday activities: delivering mail through a mail slot, opening a door with a key, and opening a window.
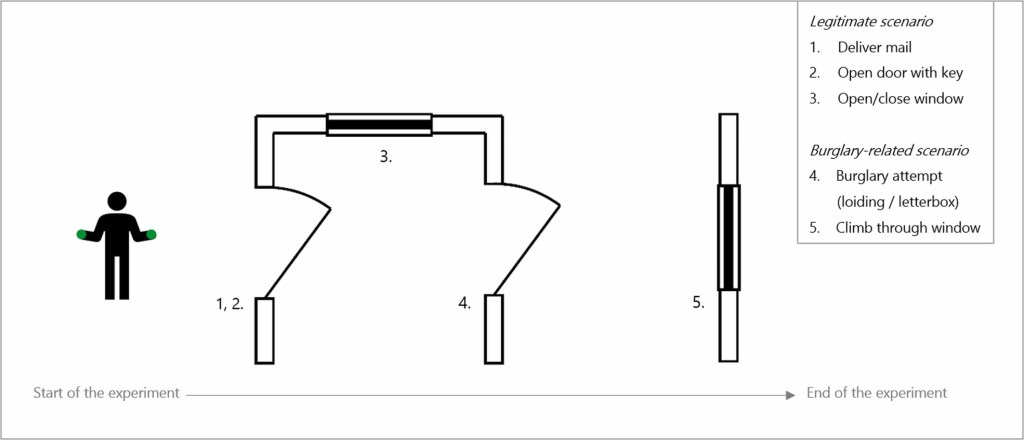
Once the participants opened the window, they retrieved one of two tools to simulate a burglary scenario. The first was a “loiding” card, an approximately postcard-sized plastic card used to open doors. The participants insert the card near the door lock and push the latch back into the door, allowing the door to open. The second object participants could retrieve is a wire hanger. This hanger was used for the “letterbox” burglary method. This method included inserting the hanger through a mailbox slot and hooking onto the door handle on the opposite side of the door, opening it from the inside. After completing their “break in” using these tools, the participants escaped through a window.
To monitor the participants’ contacts around the simulation area, the researchers applied paint to the participants’ hands so they would leave a visible trace of their contact. After activity completion, the scene was photographed like a standard crime scene – a series of overview photos followed by detailed, up-close photos. The de Poot group first reviewed all photos for suitability (presence of measuring tapes along the sides of doors and windows, glare, etc.) and then mapped the photos onto a grid created for the doors and windows. Once all the paint locations were mapped onto the grids, the authors created heatmaps of the frequency of areas touched in each scenario.
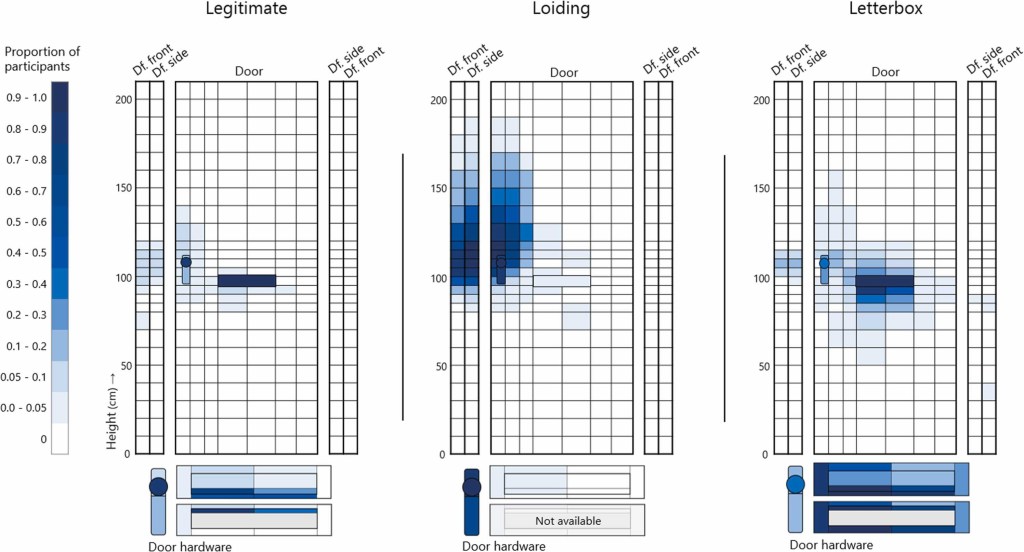
The authors reported striking differences in paint localization between the “normal” activities and those that mimic residential burglary (Fig. 2). During “normal” door usage, the researchers noted that the paint was localized almost entirely to the doorknob and edges of the mail slot. In contrast, in the “loiding” burglary scenario, participants spread paint around the doorknob on the door and nearby door frame. For the coat hanger/letterbox scenario, the surrounding hardware of the mail slot was more covered in paint than the “normal” scenario in which mail was delivered. Additionally, the 10 cm immediately below the mail slot also had elevated paint levels.
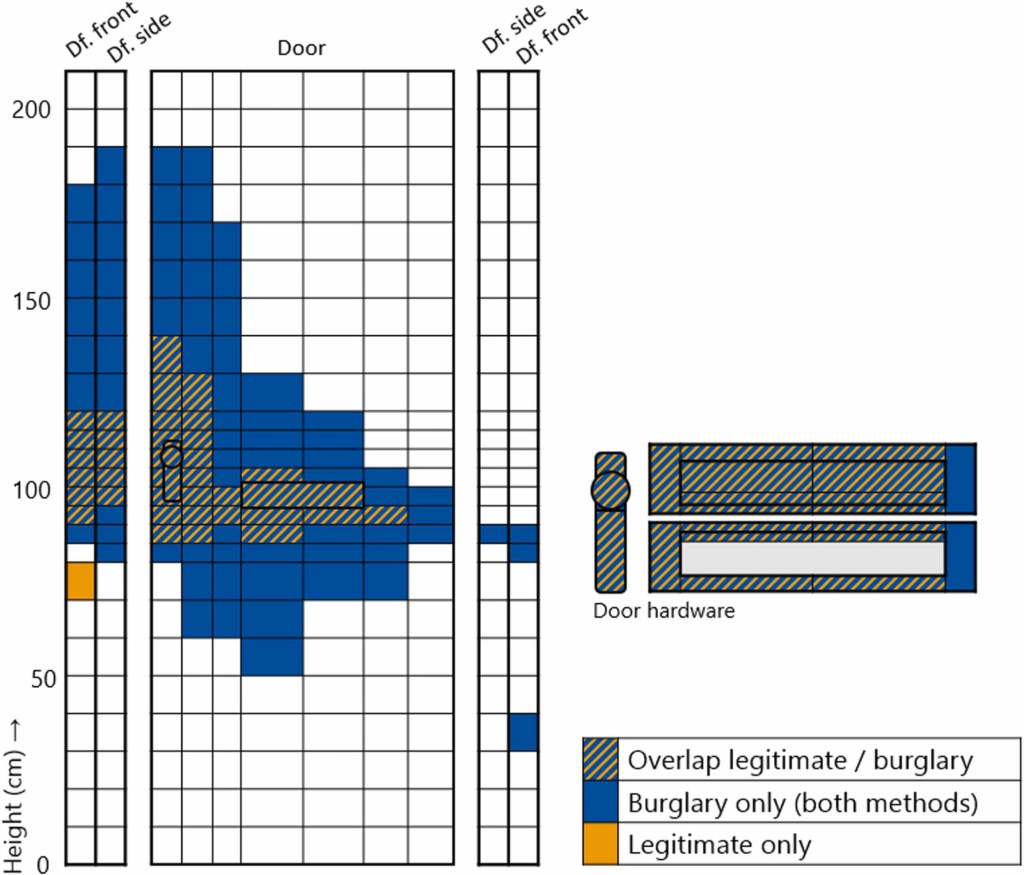
In general, the researchers found that the burglary activity contact zones extended far past the normal touch zones (Fig. 3). This means that there are areas of the door in which it is much more likely a forensic analyst will find only fingerprints of a perpetrator after a crime compared to a resident of the home. One caveat the researchers identified, though, is that the burglary-only zones had relatively low incidents of touching. This means that not every crime scene is guaranteed to have fingerprints or DNA left behind in these areas.
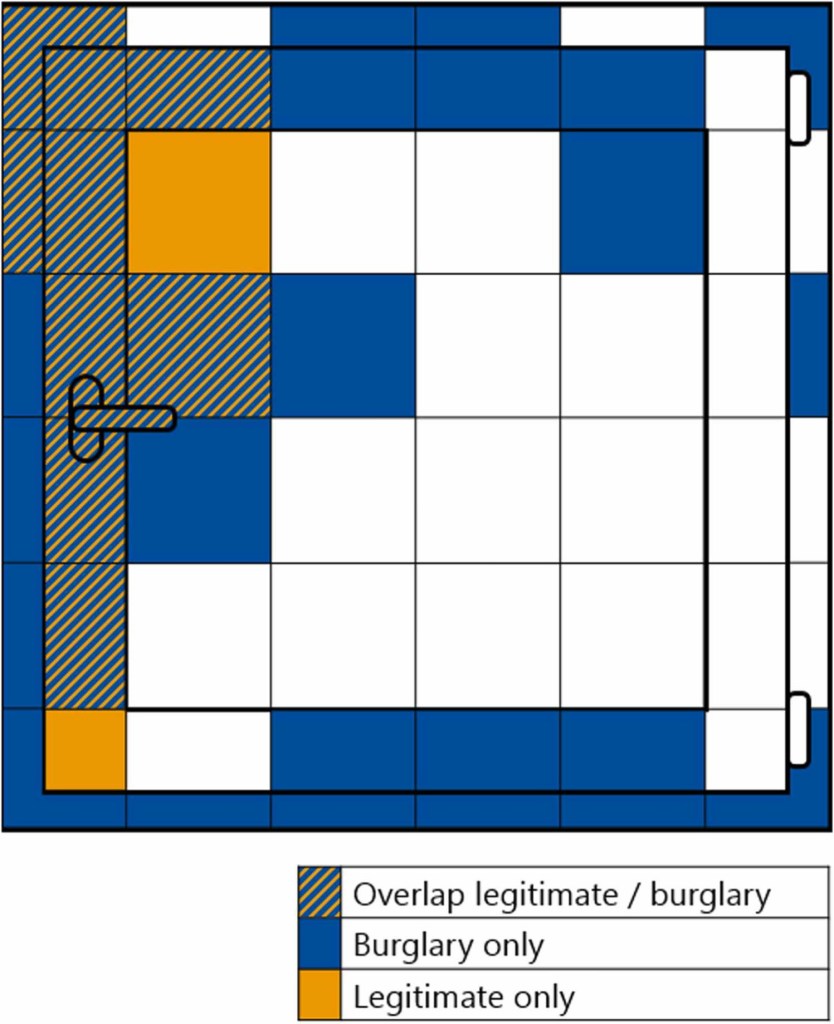
Analyzing the windows in both scenarios was less clear-cut than the doors. As expected, during normal activities, the window was mostly touched on the window handle. When the participants were asked to climb through the window, they touched more of the window frame, and touch patterns on the exterior frame of the window were also identified. However, the localization profiles for normal and burglary activities on the windows were less pronounced, likely due to multiple “window-exiting” techniques. Ultimately, with such wide-spread localization patterns, the chances of finding perpetrator fingerprints in any one area on windows are low (Fig 4).
Each crime scene is a ticking bomb. Every minute of delay between knowing where (and what) to collect and collecting it allows evidence to become lost. CSI techs remain the most critical decision makers to solving a crime when it comes to forensic evidence. The results from this study provide a tentative map for fingerprint and latent DNA distribution at burglary crime scenes that forensic examiners can use to inform their collection decisions. While the researchers admit to shortcomings in the study, ranging from their participant pool to the weak correlations in window heatmapping, they believe that supplementing forensic examiners’ experience-based strategies with a data-informed framework will allow for better, faster, and more accurate identification of latent evidence at burglaries. This will, hopefully, allow forensic teams to solve more burglary cases in the near future.
| Title | Determination of relevant sampling locations for burglary investigations |
| Authors | Rik Aulbers, David ReddeYoram R. Goedhart, Katharina Draxel, Androniki S.I. Katsikis, Ingrid Jullens, Anouk de Ronde, Bas Kokshoorn, Christianne J. de Poot |
| Journal | Forensic Science International |
| Year | 2025 |
| URL | https://www.sciencedirect.com/science/article/pii/S0379073825002531 |
