
Researchers at the University at Albany have determined how to track changes in blood stains to determine their age using Raman spectroscopy.
Featured image credit: Geralt from Needpix
In a criminal investigation, blood evidence is a huge bonus for investigators. Blood can give important insight into the nature of the crime itself. More importantly, it is a source of DNA, which scientists use for profiling to assign blood to a specific person. More recently, researchers wanted to see if blood could also help determine when a crime was committed.
Time since deposition (TSD) tells how long it has been since blood was deposited. If an investigator determines that blood found at a crime scene has a TSD of one week, they can estimate that the crime was committed a week ago. TSD can also help investigators determine if blood found is actually relevant to the crime. For example, weeks-old blood found at the scene of a crime that happened the night before would not be relevant to the investigation.
There are several methods for determining the TSD of blood, such as UV/Vis spectrophotometry and high-performance liquid chromatography. Most of these tests will destroy the sample, which can make it hard to do further testing, such as DNA profiling. Additionally, these methods are still in the experimental phase and are not accurate or reliable. To resolve these issues, researchers at the University at Albany led by Dr. Igor Lednev have looked to a spectroscopic technique called Raman spectroscopy. The Lednev group has done extensive work with Raman spectroscopy, and have demonstrated its ability to analyze several types of evidence such as GSR and drugs.
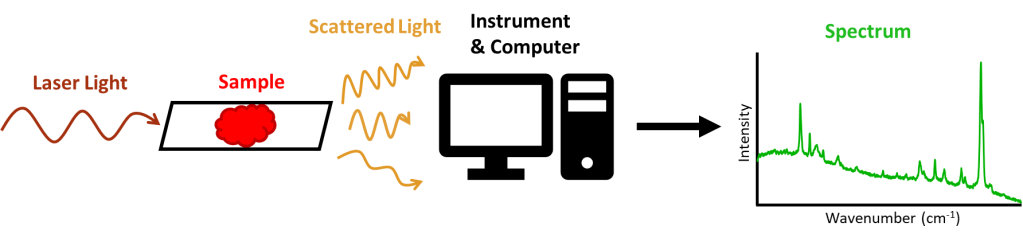
Spectroscopy measures the interactions of a material with light. In Raman spectroscopy, an instrument measures the amount of light a material scatters when it has been hit with a laser. The amount and the energy of the scattered light depends on the chemical structure of the materials tested, so every material will produce its own unique Raman spectrum (Fig. 1).
In previous research, the Lednev group demonstrated that Raman spectroscopy can distinguish different body fluids using their unique spectra caused by their differing biological components. These components will change, however, as the body fluid dries and ages. Exposure to oxygen in the air causes certain compounds in blood to oxidize, particularly the iron-containing compound hemoglobin. This causes a change in the charge of the iron, which changes the structure of the compound and how it interacts with light. Because of this, the researchers hypothesized that they should be able to track the changes in blood composition over time to estimate the TSD.
The researchers collected Raman spectra for blood from a male and female donor at various time points ranging from one hour to one week. They then performed two statistical tests on the spectra: correlation analysis and partial least squares regression (PLSR). Correlation analysis described the order in which the changes in the spectra happened. PLSR allowed the researchers to determine whether the changes in the spectra were random or related to blood age, and ultimately to make TSD predictions.
The Lednev group determined that some Raman signals that were caused by hemoglobin changed with age (Fig. 2). One specific signal was the 377 cm-1 peak, which was identified as a marker for metHb, the oxidized form of hemoglobin (Fig. 3). This peak increased as the blood aged. The 1637 cm-1 peak (identified as the oxygen marker) decreased with time. These changes showed that as the blood aged, the amount of oxygen in the blood decreased while amount of oxidized hemoglobin increased.
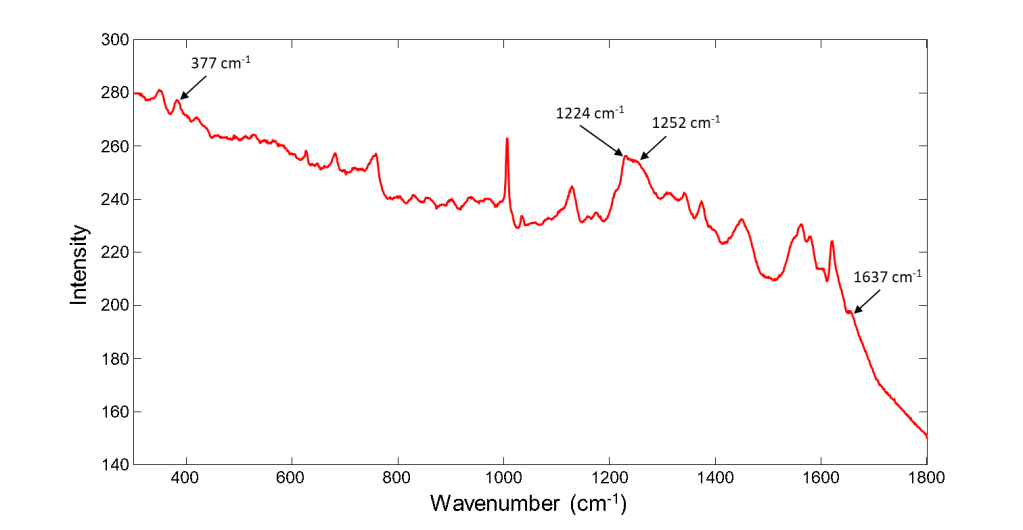
The correlation analysis found that two other specific signals in the Raman spectrum changed together over time. These peaks (1224 cm-1 and 1252 cm-1)represent different shapes of metHb. The 1224 cm-1 peak represent the protein in a sheet form, whereas the 1252 cm-1 represents its random coil form. The analysis found that the 1224 cm-1 peak decreased while the 1252 cm-1 peak increased, and that the decrease in the sheet-metHb peak occurs first. This indicated that the metHb loses its sheeted structure, and then begins to aggregate, or cluster, into randomly coiled structures. Lednev and co. used this data to confirm the changes of hemoglobin in aging blood and how they could be monitored to determine TSD (Fig. 3).
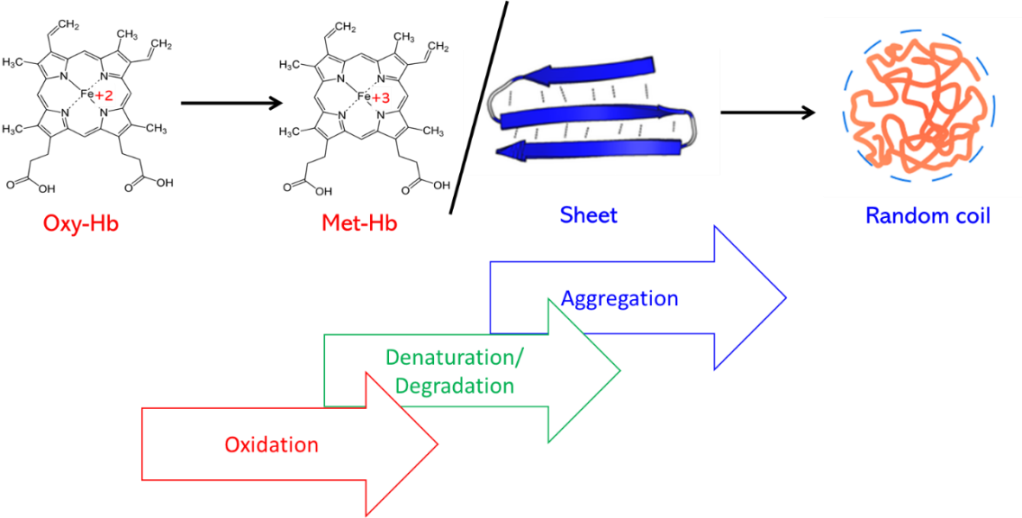
Figure 3. Process of hemoglobin aging in blood. Credit: Hemoglobin structure from Yikrazuul, sheet structure from Thomas Shafee, and random coil structure from Daniele Pugliesi, (Wikipedia, available via CCL)
The researchers built a prediction model using PLSR to determine the ability of this method to predict TSD of non-tested samples. They used the male donor’s blood to make the model and then assessed the accuracy of the model’s predictions using the female donor’s blood. The changes in blood spectra allowed for the PLSR program to predict the age of blood stain samples. The program estimated the TSD of these blood samples correctly and consistently.
The Lednev group demonstrated that Raman spectroscopy could be used to accurately determine the TSD of blood by tracking the changes in clean aged blood spectra. In the real world, however, blood samples will be subject to various climates and/or environmental contamination that can hinder this analysis. In order to make this technique implementable in the field, the effects of various conditions, such as different temperatures, levels of sunlight exposure, and humidity, as well as blood deposited on various surfaces (e.g. wood, tile) and materials (e.g. cotton clothing, upholstery), must be researched. This information will be important for forensic investigators to take into account when using this method to analyze blood evidence in real cases.
| Title | A Raman “Spectroscopic clock” for bloodstain age determination: the first week after deposition |
| Authors | Kyle C. Doty, Gregory McLaughlin, Igor K. Lednev |
| Organization | University at Albany, Albany, NY |
| Year | 2016 |
| Journal | Analytical and Bioanalytical Chemistry |
| Link | https://link.springer.com/article/10.1007/s00216-016-9486-z |

One thought on “How can blood tell us when a crime happened?”