
Featured image credit to Pixabay
Crime scenes can be messy and disorganized places, taking days to collect evidence and weeks to analyze in the laboratory. Analysts and researchers alike are working towards improving all parts of the crime solving process to speed up cases and provide better analysis methods.
Bloodstain pattern analysis can be an especially tricky task, depending on the severity of the scene. Some analysts have the benefit of using automated software to determine patterns and trajectory, while others have to use lasers, or basic tools, like rulers, strings and protractors. But what if we could use advanced image software to not only decipher patterns in blood, but gain information about the person who left it?
A group of researchers at Nottingham Trent University from the Exercise and Health Department and the Physics and Mathematics Department are applying machine learning to answer this question. Machine learning is a form of data analysis to create models from training datasets that allow machines to “learn” patterns and either form predictions (take past data and apply to future data) or recreations (backtrack from the output to the input). For example, machine learning could determine the blood spatter pattern in its original form from its dried version. Currently, automated software can only analyze bloodstain patterns once dried, but this poses issues due to the changes that occur to the pattern after evaporation. When a drop of blood contacts a surface, it begins to evaporate, causing particles from the center to move outward to the edges. This in turn changes where the blood droplet’s centroid, or center of mass, is located. The centroid allows the automated software to calculate trajectory, or the path, speed and angle of impact. Machine learning could eliminate the issue by extrapolating the original centroid and trajectory from the dried spatter commonly found on scene.

The researchers also wondered if they could expand the software’s purpose to determine physiological conditions from bloodstain pattern images; that in analyzing the dried blood, for example, analysts could determine if the donor exercised beforehand. This function of the software would be novel as it could determine a phenotype or behavioral characteristic from an inanimate object like a photograph.
Thirty healthy males from 17 to 31 years old were asked to ride a stationary bike until their breathing reached a threshold or they started pedaling too slow. Blood was taken from each subject directly before riding, directly after riding, and at various intervals during recovery (i.e. the slow, more relaxing stretches performed post-high-stress exercise). The blood samples were analyzed both before and after drying for the levels of ten biomarkers and parameters, such as pH, carbon dioxide pressure, metabolites (e.g. bicarbonate, chloride), various minerals (e.g. potassium, sodium, calcium), and evidence of physical exertion (elevated lactic acid and low glucose levels). These biomarkers can give indications of certain health conditions or the regulation of bodily functions.
Droplets were placed on slides and evaporated overnight. The wet blood served as the true starting point to compare with dried samples and allowed accurate determination of the actual biomarker concentrations when comparing different time points. In this case, the wet blood chemistry is the ground truth, or known/expected result. The researchers dried the blood for the machine learning algorithm for two reasons: 1) this is the standard operating procedure currently in place for bloodstain pattern analysis and 2) evaporation of the bloodstains can change the pattern (mentioned previously), which needs to be accounted for in the analysis.
Images of each droplet were taken with a digital camera and the preprocessed using various image corrective methods (Table 1 and Figure 2). Often times, due to the complexity of the analysis, data inputted into the algorithm need to go through steps of pre-processing.
| Processing | Function |
| Crack filling | Cracks can cause distortions. Filling in natural cracks in dried blood increases quality of analysis. |
| Gaussian filter | Smooths the edges of the blood droplets |
| Edge detection | Detects edges of blood droplets and ignores possible interference of marks on background |
| Polar coordinate system | Transforms circular drop to linear plot and helps show symmetry |
| Power spectrum | Helps data become immune to rotations and increases quality of analysis |
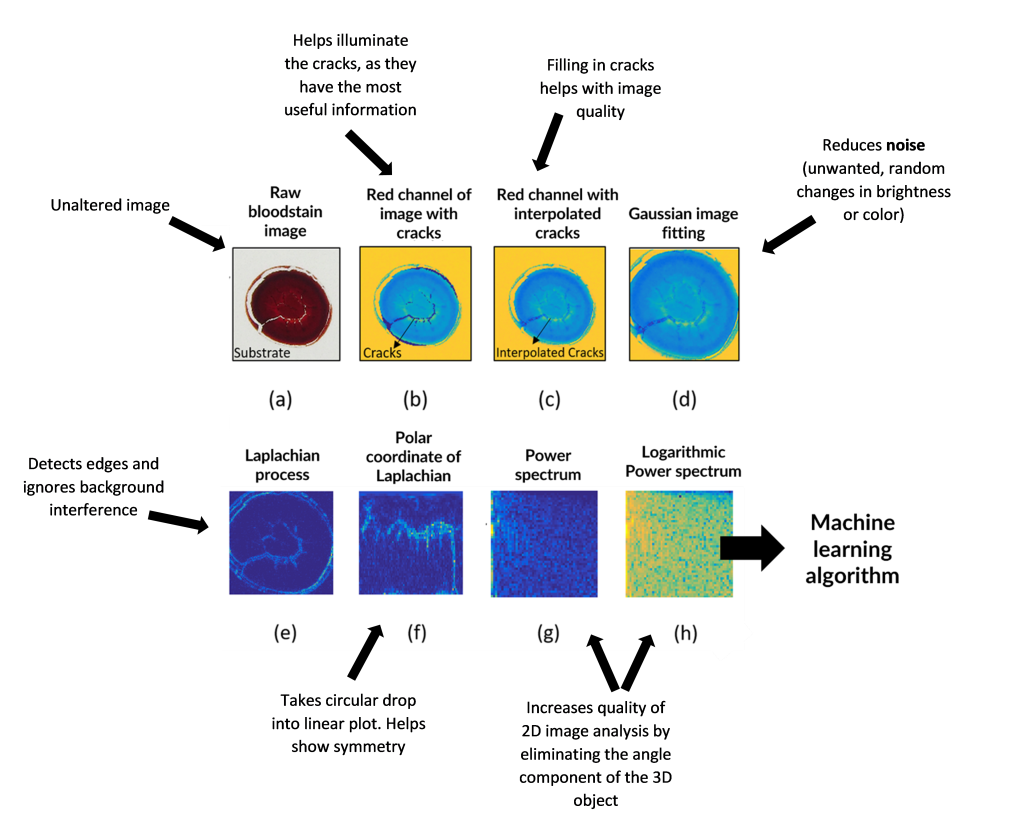
Figure 2. Example of the processing performed on the images and how it helps the analysis. Adapted from the article.
From the analysis of the wet blood, some components in blood have a strong correlation (relationship between variables), but that correlation decreases over time. For example, the pH and carbon dioxide pressure had a negative correlation when the exercise volunteer was at rest i.e. the pH increased as the carbon dioxide pressure decreased. But when the volunteer was exercising or had just finished, that correlation was no longer as strong; one variable still decreased as the other increased, but not as much. However, statistical analysis suggested that even six minutes into recovery, the correlations between pH and carbon dioxide pressure, for example, began to return to pre-exercise conditions.
However, image analysis shows that extracted data does not return to pre-exercise conditions. This suggests that the evaporation of the liquid does in fact alter the pattern and that the evaporation is not affected by one of the ten biomarkers chosen in this study. Over the four time intervals studied after exercise, the correlations fluctuate at a lower strength for image compared to the blood chemistry testing. The authors believe that if more blood was taken at longer recovery times, they would see the correlation return to pre-exercise conditions.
While this study does lead to more questions, the novel study provided initial groundwork for utilizing machine learning to discriminate blood droplets instead of human observation. Automated methods allow a more objective approach to the analysis of bloodstain patterns, a perspective needed in multiple scientific disciplines, especially in disciplines with legal consequences like forensic science.
| Title | Machine Learning Analysis for Quantitative Discrimination of Dried Blood Droplets |
| Authors | Lama Hamadeh, Samia Imran, Martin Bencsik, Graham R. Sharpe, Michael A. Johnson, David J. Fairhurst |
| Journal | Scientific Reports |
| Publisher | NatureResearch |
| Year | 2020 |
| Link | https://www.nature.com/articles/s41598-020-59847-x |
