
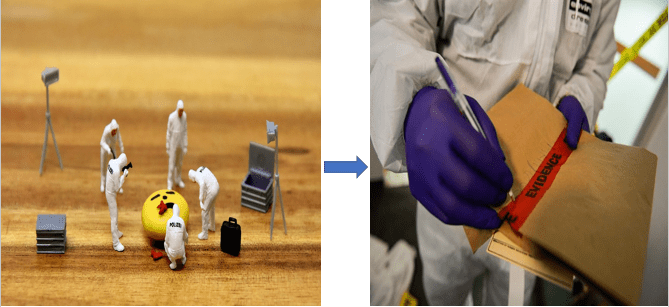
Source for feature photo: “Sean Patterson, quality management section DNA analyst” by Staff Sgt. Nicole Leidholm
DNA analysis is often used to gain information from samples found at a crime scene. There are many steps involved in obtaining DNA from a sample to generating a DNA profile. Crime scene technicians collect and preserve any evidence found at the scene. Once a piece of evidence is brought back to the laboratory, analysts determine if DNA testing is needed. Sometimes DNA testing is not needed as determined by preliminary screenings. If DNA is not present in the sample (i.e. the “red stain” is rust, not blood), DNA testing is not needed. There are also instances where samples undergo DNA extraction, but the extracted amounts are not enough to run further testing on the sample.
DNA technologists examine the evidence for any body fluids or biological materials present, such as blood stains, semen or saliva. Next, analysts sample the body fluid, usually by swabbing the stain with a cotton swab. Then lab technicians extract DNA using their lab’s standard operating procedure or SOP. Though different SOPs exist, typically one is chosen by each lab head based on the expertise of the available personnel, overall cost and available equipment. The DNA extraction process determines the amount of DNA that will be available for use. When dealing with trace amounts of DNA, extraction can yield very small amounts of DNA (less than 100 micrograms) or very dilute (weaker) samples that ultimately affects whether the DNA analyst gets a partial or complete DNA profile.
During extraction, cells are broken apart to release the DNA using a lysis solution to get the DNA out. The DNA is then filtered out from everything else that is not needed (oils, debris, dirt), and precipitated from the lysis solution. Most people associate the term precipitation with rainfall, and the process is very similar; just as the rain forms and comes out of the clouds, that is how we will see the DNA form out of the solution (Fig 2). Once the DNA is separated, the sample is “cleaned” of any remaining interfering debris and readied for quantitation.
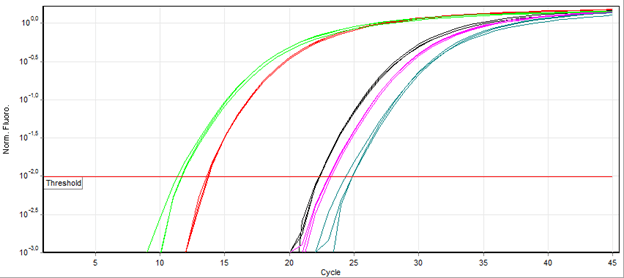
DNA quantitation is next! This process measures the total amount of DNA present in your volume of sample after breaking apart the cells. Quantitating DNA lets us know which detection methods are needed to generate the best DNA profile possible and avoid repeat testing. Knowing the amount of DNA is crucial in ensuring that there is enough to run all testing needed, or if the sample needs to go through another extraction to obtain more DNA. The amount of DNA can negatively affect whether a low-quality or a full and complete DNA profile is generated. Typically, analysts amplify a single region of the DNA sequence specific to humans (to make sure we are not mistaking animal/bacteria DNA for human DNA!) and see how long it takes the sample to hit a certain threshold (shown by red line). The faster an amplifying sample reaches the threshold, the more DNA present, and the more likely you can amplify all the regions of DNA to obtain a forensic profile (Fig 3).
After quantitation is complete, lab techs take the original sample forward to amplify the short tandem repeat (STR) regions of the DNA. This amplification step results in millions of copies of STRs using a chemical process called polymerase chain reaction or PCR.
These regions are what interest DNA analysts, and what is compared between the sample obtained from the crime scene and a known sample from an individual.
Think of DNA as a book. Within the book, the enzyme that replicates DNA in PCR is looking for certain words. These words are found, first, by locating the page or chromosome that the DNA sequence is on. Once it finds the page, the enzyme then targets the paragraph the sentence is in, or locus (location) within the chromosome that the DNA sequence is located in.
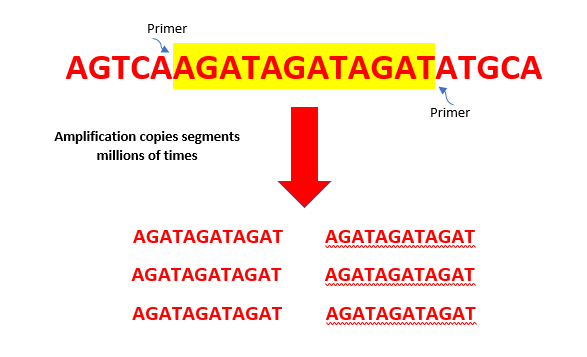
Next, the enzyme zeroes in on the sentence, or DNA sequence. We use primers (short DNA sequences that match the words or segments of interest) to locate the start and end of the words or segments of STRs. These STRs are then amplified and copied millions of times in many cycles so that they can be detected and visualized for analysis. The more cycles the DNA goes through, the more copies that are made, which increases the chances of getting an optimal DNA profile even from trace amounts of DNA.
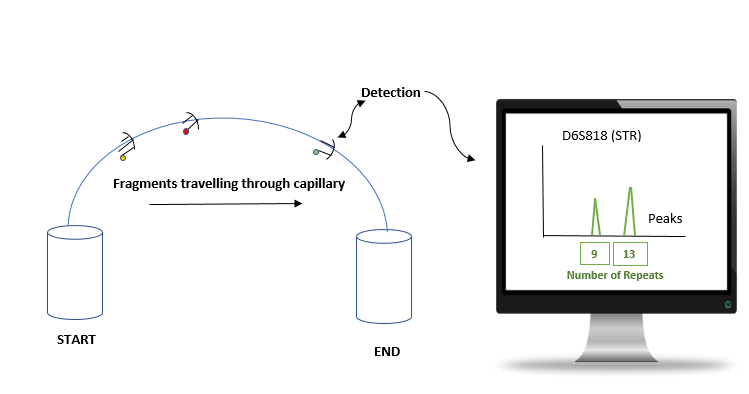
Once the STRs have been amplified, we can measure and identify the DNA “sentences” in the sample. Detection of the STRs and their repeats occur through capillary electrophoresis (CE). With CE, the STRs are separated by size (i.e. the length of the repeat), starting on one side of a thin tube, known as a capillary, and travelling through to the other side. Based on their size, the fragments can move slowly (for larger fragments) or quickly (for smaller fragments), dragged forward by the attractive pull of a positive charge to the negatively charged fragments. The fragments pass through a detector that reads the color-tag found on the primer and assigns a color to each locus fragment. After all fragments have passed through the capillary, data is sent to the computer, producing “peaks” that the analyst uses to generate a DNA profile. (Fig 5) Different fragments of similar size will produce similar peaks; these fragments are assigned a different color tag so that analysts can differentiate between the different loci. Fragments that are different sizes can be assigned the same color tag because it is easier to tell them apart.
Finally, the last step (PHEW!); the analysis and interpretation of the peaks generated from CE detection. Scientists interpret all peaks and repeats generated from the data and confidently match the profile from the sample to one person or, in the case of a mixture, to multiple people. DNA profile analysis can sometimes be straightforward, in the case of single donors matching a known standard, or quite complex, like with increasing number of DNA contributors. For example, with a 3-person mixture, you can see multiple combinations of alleles (shown below by the STR repeat number for each peak) for each loci, with some having the maximum allele combination of 6; in those cases, every DNA “donor” has two different copies of the allele!

The scientist first analyzes the DNA profile of the sample found at the crime scene, followed by any DNA profiles from known samples. For example, if a CSI tech found a bloody knife and wanted to figure out who was injured, they would collect a swab of the “unknown” blood, then DNA samples from all suspects and victims. The lab technician would first independently determine the profile of the “unknown” sample, and then all of the “known” samples collected. Both types of DNA profiles are analyzed separately to avoid introducing bias from the analyst for the comparison stage.
Once both types of DNA profiles are analyzed separately, they can be compared to one another to determine their source. Analysts use 20 STRs to make comparisons between profiles. The combination of these 20 STRs are unique between individuals, and this uniqueness is statistically calculated by the likelihood of getting the same exact 20 STRs in two people when matching two DNA profiles. This likelihood ratio determines how confident the analyst is when including (present in the sample) someone in the sample or excluding (not present in the sample) someone from the sample. For example, if the likelihood ratio is 10,000, the probability that the two profiles being compared are the same is 10,000 times as great if the samples came from the same person as it is if they came from different people.
In instances where trace DNA is used, the analyst might have poor quality data and can only generate a partial profile. The partial profile may be enough to make a statistically usable match between a DNA profile from a suspect and a sample found at the crime scene; however, as fewer STRs are used when comparing profiles, the harder it gets to exclude an individuals from a sample. Think of it this way: If you have a barcode with 9 numbers (123456789), it is less likely that you will find another person with the same exact 9 numbers. Whereas, if you had a partial barcode with only 3 numbers (123), the chances that other people will have the same 3 numbers is very high. Analysts want as many numbers in the barcode as possible, so that everyone but the suspect can be excluded from the sample found at the crime scene.
To obtain high quality data and as complete “barcodes” as possible, scientists strive to ensure that each step in the entire DNA flow-through process – extraction, quantification, amplification and profiling – is performed efficiently and effectively. This increases the chances of obtaining a full and complete DNA profile that can be used to link a suspect to a crime with great statistical confidence. Now you know the basics of what goes on behind the scenes of DNA processing.
| Title | Forensic trace DNA: a review |
| Authors | Roland AH van Oorschot, Kaye N Ballantyne, R John Mitchell |
| Journal | Investigative Genetics |
| Publisher | PubMed Central |
| Year | 2010 |
| Link | https://www.ncbi.nlm.nih.gov/pmc/articles/PMC3012025/#__ffn_sectitle |

6 thoughts on “Behind the Scenes: DNA Processing”