
Featured image credit to Pixabay
Fibers are a common type of forensic trace evidence and can be used to link a suspect, scene and victim. But the general presence and composition of fibers prevents the specificity that detectives and crime scenes techs crave. Could a new statistical analysis called Lasso increase the evidentiary value of fibers?
We come into contact with fibers hundreds of times a day in our clothing, the carpets, bedding, towels and on furniture. The fibers on a suspect’s clothes or from their personal items can be transferred either directly or through secondary transfer (transferring to one item and then transferring again). The fibers left behind on a victim or a scene can then be used in an investigation to form connections between suspects, victims or the location.
However, just because fibers can be classified as similar between a suspect and victim/scene, does not hold a significant discrimination power because certain fibers are so common. For example, finding a blue cotton fiber at a crime scene may not be helpful, as cotton is one of the most common fibers used worldwide .
Scientists in the forensics community are trying to find ways to better discriminate between two fibers of the same composition and color. A group at the University of South Carolina applied a new regression analysis called Lasso to predict the classification of fiber types and compare it to current methods of analysis.
When an analyst receives fiber evidence, there are two types of analysis that can be performed; identification or comparison. More often than not, an analyst will be performing a comparison examination between two or more fibers in favor of identification. Using a polarizing light microscope, different features of the fiber can be assessed, like length, width and cross section. A microspectrophotometer (MSP) will analyze the color of the fiber and provide a spectrum for comparison (Fig 1.). This spectrum provides a large amount of information that analysts can interpret using chemometrics (use of math or statistics to understand chemical information) or statistical analysis to sort it.
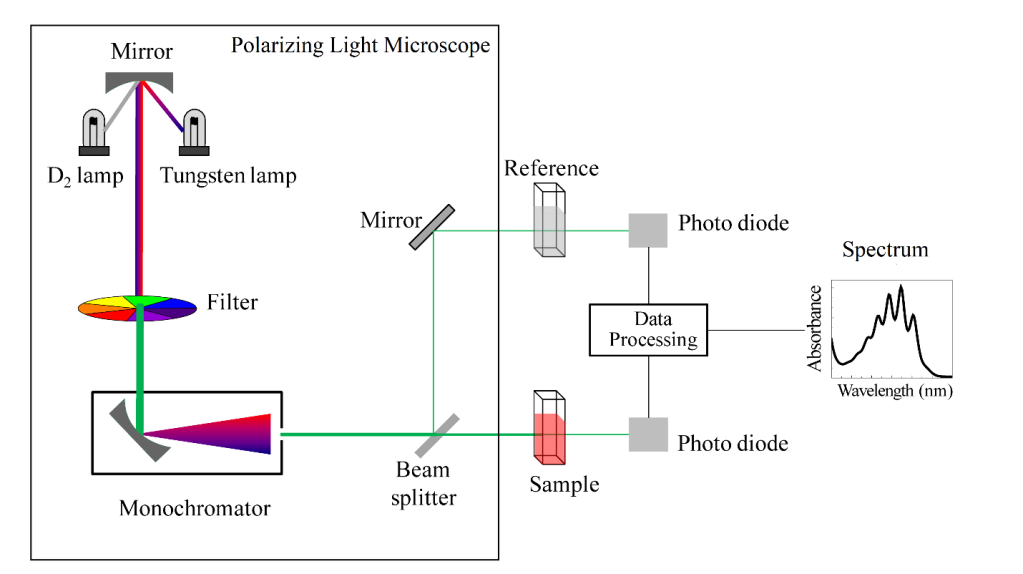
Figure 1. Schematic of a UV-Vis microspectrophotometer.
Photo credit: Wikimedia Commons
Two common chemometric analyses are principal component analysis (PCA) and linear discriminant analysis (LDA). Principal component analysis (PCA) reduces the number of data dimensions, by eliminating variables with low variation (called feature elimination) which allows you to look at the variables with the most differences between them. Linear discriminant analysis (LDA) differentiates the data points with a different method of feature elimination and focuses on maximizing the discrimination between groups. For example, when trying to compare two fibers, using PCA can eliminate features that are two similar between the two while LDA will emphasize presenting features that are the most different; the results may be the same with both methods but how you get your answer is slightly different. However, due to the requirements for PCA and LDA analysis, the analysis can often become complex, have low prediction accuracy and may not achieve any feature selection.
Least absolute shrinkage and selection operator or Lasso is a different technique that the authors compared to PCA and LDA for its prediction accuracy of fiber samples. Lasso reduces the number of parameters, in this case information from the microspectrophotometer. This parameter reduction will allow for feature selection that is not always possible with PCA and LDA. The reduced data is then used in a likelihood ratio to predict its class.
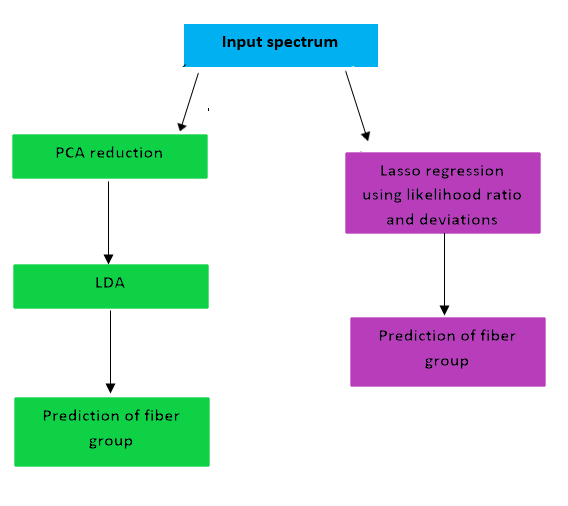
Figure 2. Flow of data analysis using both methods from the study.
For this study, the researchers created a database of over 700 fibers from multiple manufacturers. The fibers included cotton, acrylic, nylon and polyester and had color categories of black, blue, brown, green, grey, orange, pink, purple, red, white and yellow. All fibers were analyzed using a microspectrophotometer. To compare the performance power, all spectra collected of the fibers were analyzed and classified using PCA/LDA and Lasso.
The study found that PCA and LDA had an 89.7% accuracy in predicting the correct dye group for the fibers. The three fibers that were misclassified had the same dye as the correct classification group but had different concentrations than the correct classification group.
On the other hand, Lasso had a 96.6% accuracy. In addition, for studies and use in a lab, PCA and LDA require a validation set, while Lasso does not, reducing the amount of time and samples needed for analysis. Furthermore, Lasso can also aid in dye concentration in addition to the identification, adding another highly discriminatory label. This feature addition could also add unique features to fiber classification, as dye concentration can change based on wear of the fibers or even additional compounds like juice and stains from spills.
This study showed that the Lasso statistical technique outperforms more traditional discrimination methods of PCA combined with LDA to classify fibers. The new technique can also provide additional information and holds up better to larger and more complex data sets. Because fibers are found so often, yet can widely vary, using Lasso in forensic analysis can greatly improve classification and identification in casework. The researchers also hope that maybe this technique can be carried over into other areas of trace evidence in the future.
| Title | Evaluating performance of Lasso relative to PCA and LDA to classify dyes on fibers |
| Authors | Dayla C. Rich, Kristen M. Livingston, Stephen L. Morgan |
| Journal | Forensic Chemistry |
| Publisher | Elsevier |
| Year | 2020 |
| Link | https://www.sciencedirect.com/science/article/pii/S2468170920300011 |
